


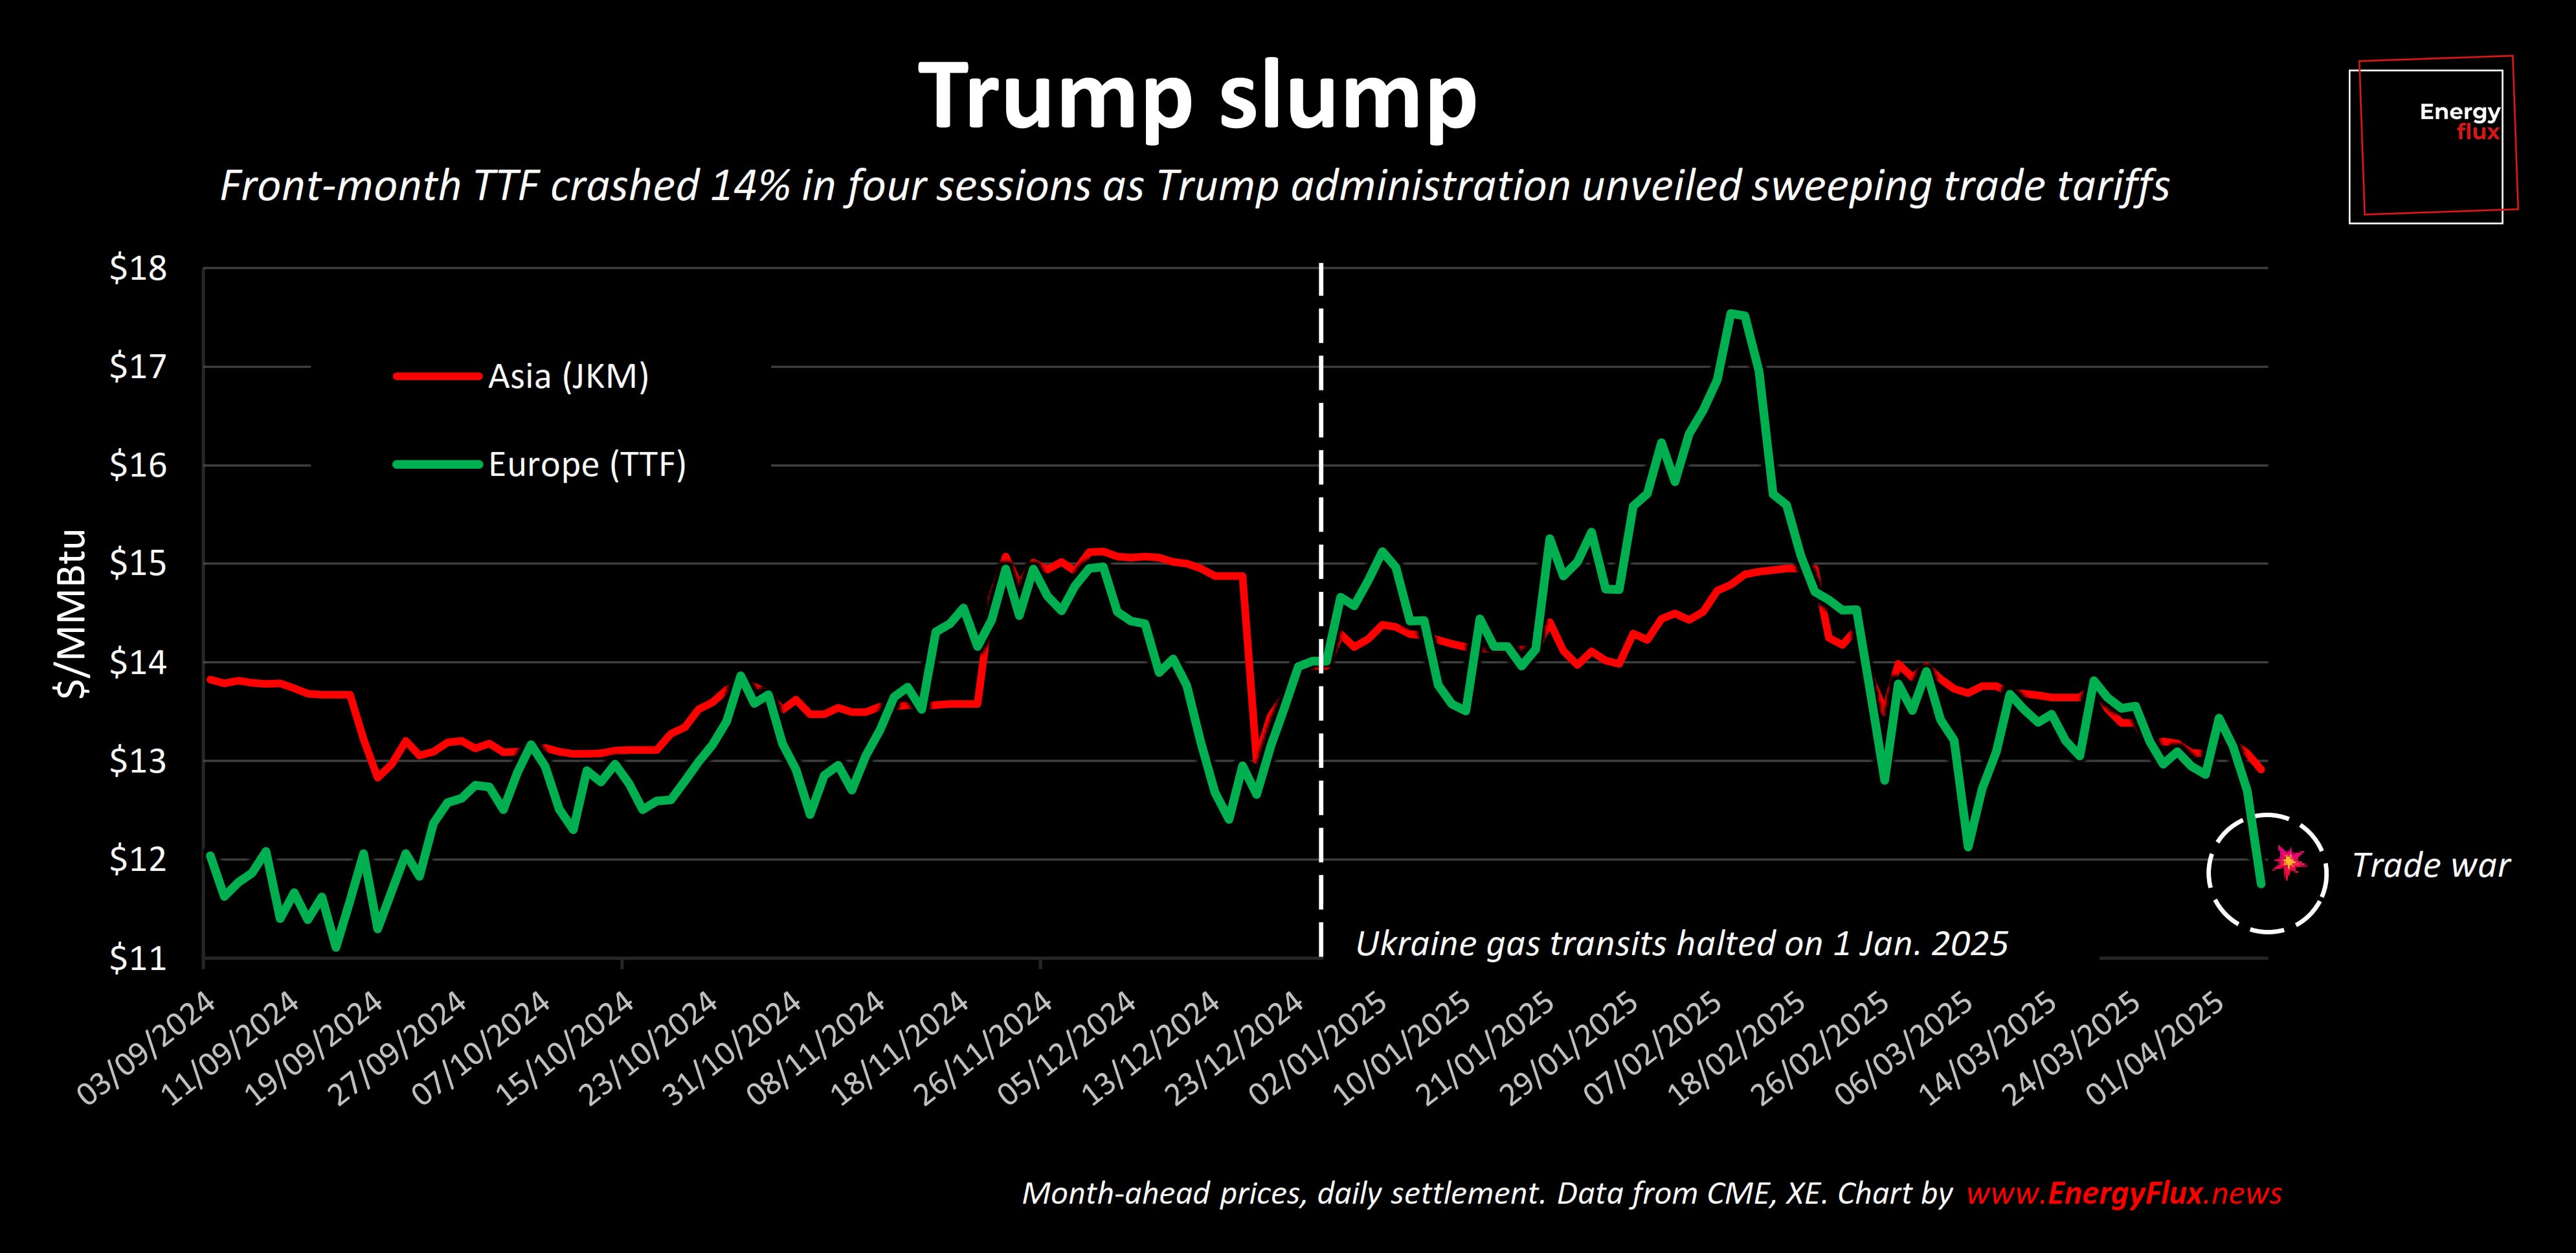
Trump slump
Trade war lunacy implodes markets and recasts the economics of LNG in Europe | EU LNG Chart Deck: 7 April 2025

Trump’s trade war is crashing the global economy and slamming the brakes on energy demand. Who’da thunk it?!
As the rulebook for post-World War 2 globalised trade goes up in smoke, fear and confusion reign supreme.
The market is struggling to parse the significance of the Trump administration’s sweeping tariffs and punitive reciprocal measures from America’s major trading partners.
For the second time this decade, supply chains, capital flows and growth projections are all in rapid dizzying flux.
Ruling elites are scrambling to save strategic industries in an unparalleled spasm of protectionism. Markets are imploding as investors flee stocks in search of safe haven assets.
Like an emergency medic warming up the defibrillator, governments are drawing up hasty stimulus plans in a bid to halt an economic heart attack.
An inflationary shock seems inevitable, and recession risk is surging. No region or segment of the global economy is safe, although some are far more exposed than others.

Liquefied natural gas stands out as a big loser in any version of Trump’s trade war.
The LNG industry’s core narrative of endless growth, predicated as it is on surging demand from emerging Asian economies, is becoming less convincing by the day.
The economics of LNG were transformed after yet another manic week in European energy markets. And if Trump remains recalcitrant, this is just the start.
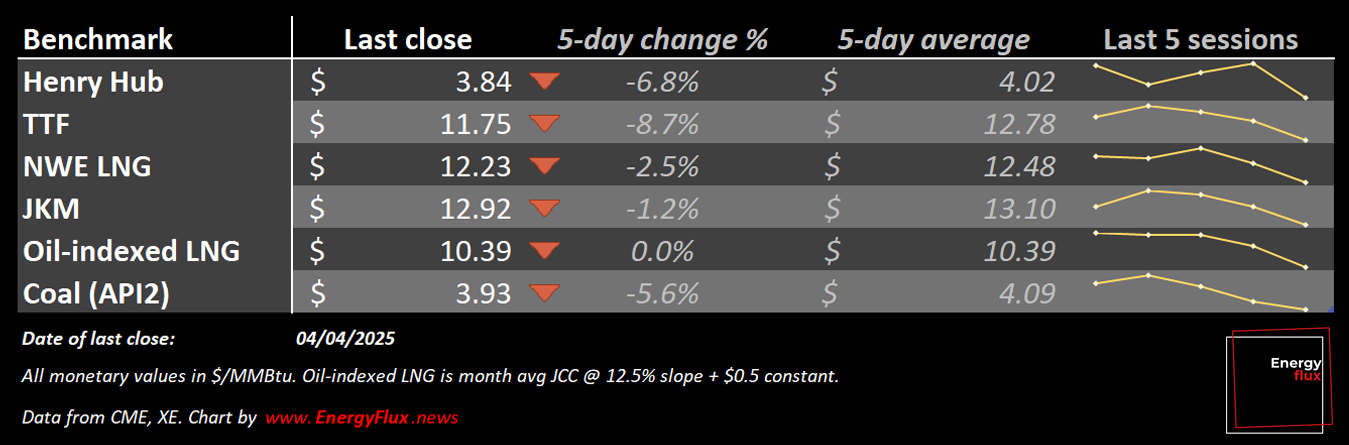
Prices on Dutch TTF, the European gas benchmark, fell 14% across four manic trading sessions between Tuesday and Friday — with profound implications for global LNG trade flows and the summer EU gas restocking season.
This week’s EU LNG Chart Deck runs the rule over how Trump’s burgeoning trade war is roiling:
TTF-JKM spreads and the LNG arbitrage opportunity to Asia
TTF calendar spreads and the economics of refilling gas storages
The competitiveness of US LNG, as Henry Hub and crude oil prices race lower
Let’s get stuck in.
Article stats: 1,200 words, 6-min reading time, 9 charts and graphs