


The bear roars!
TTF selloff gains pace, but regulatory standoff sets the stage for a rebound | EU LNG Chart Deck: 27 February 2025

What a fortnight! Bearish sentiment has swamped the European gas market, dragging prices to 10-week lows. What’s driving the correction, and how much further will it run?
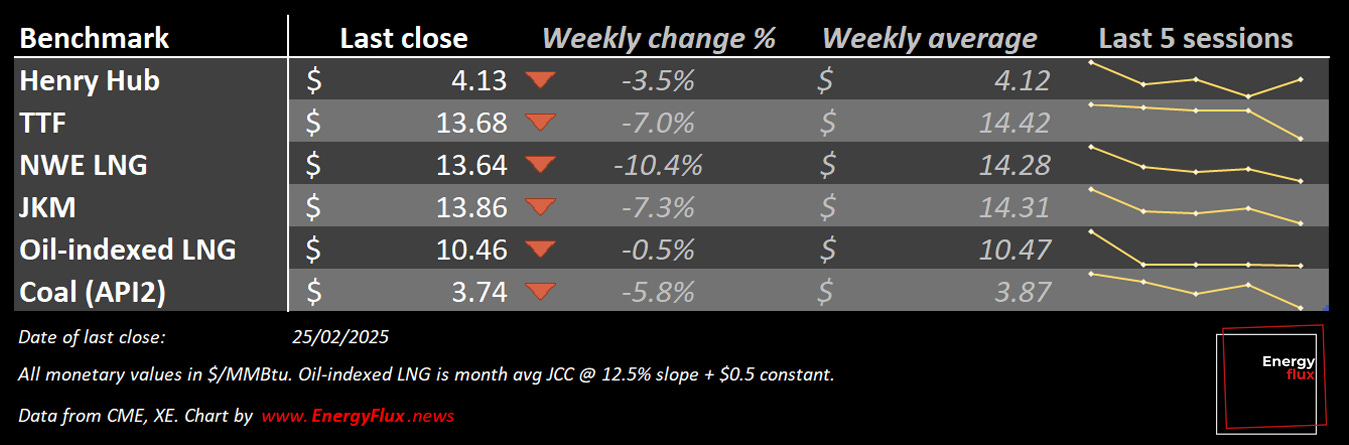
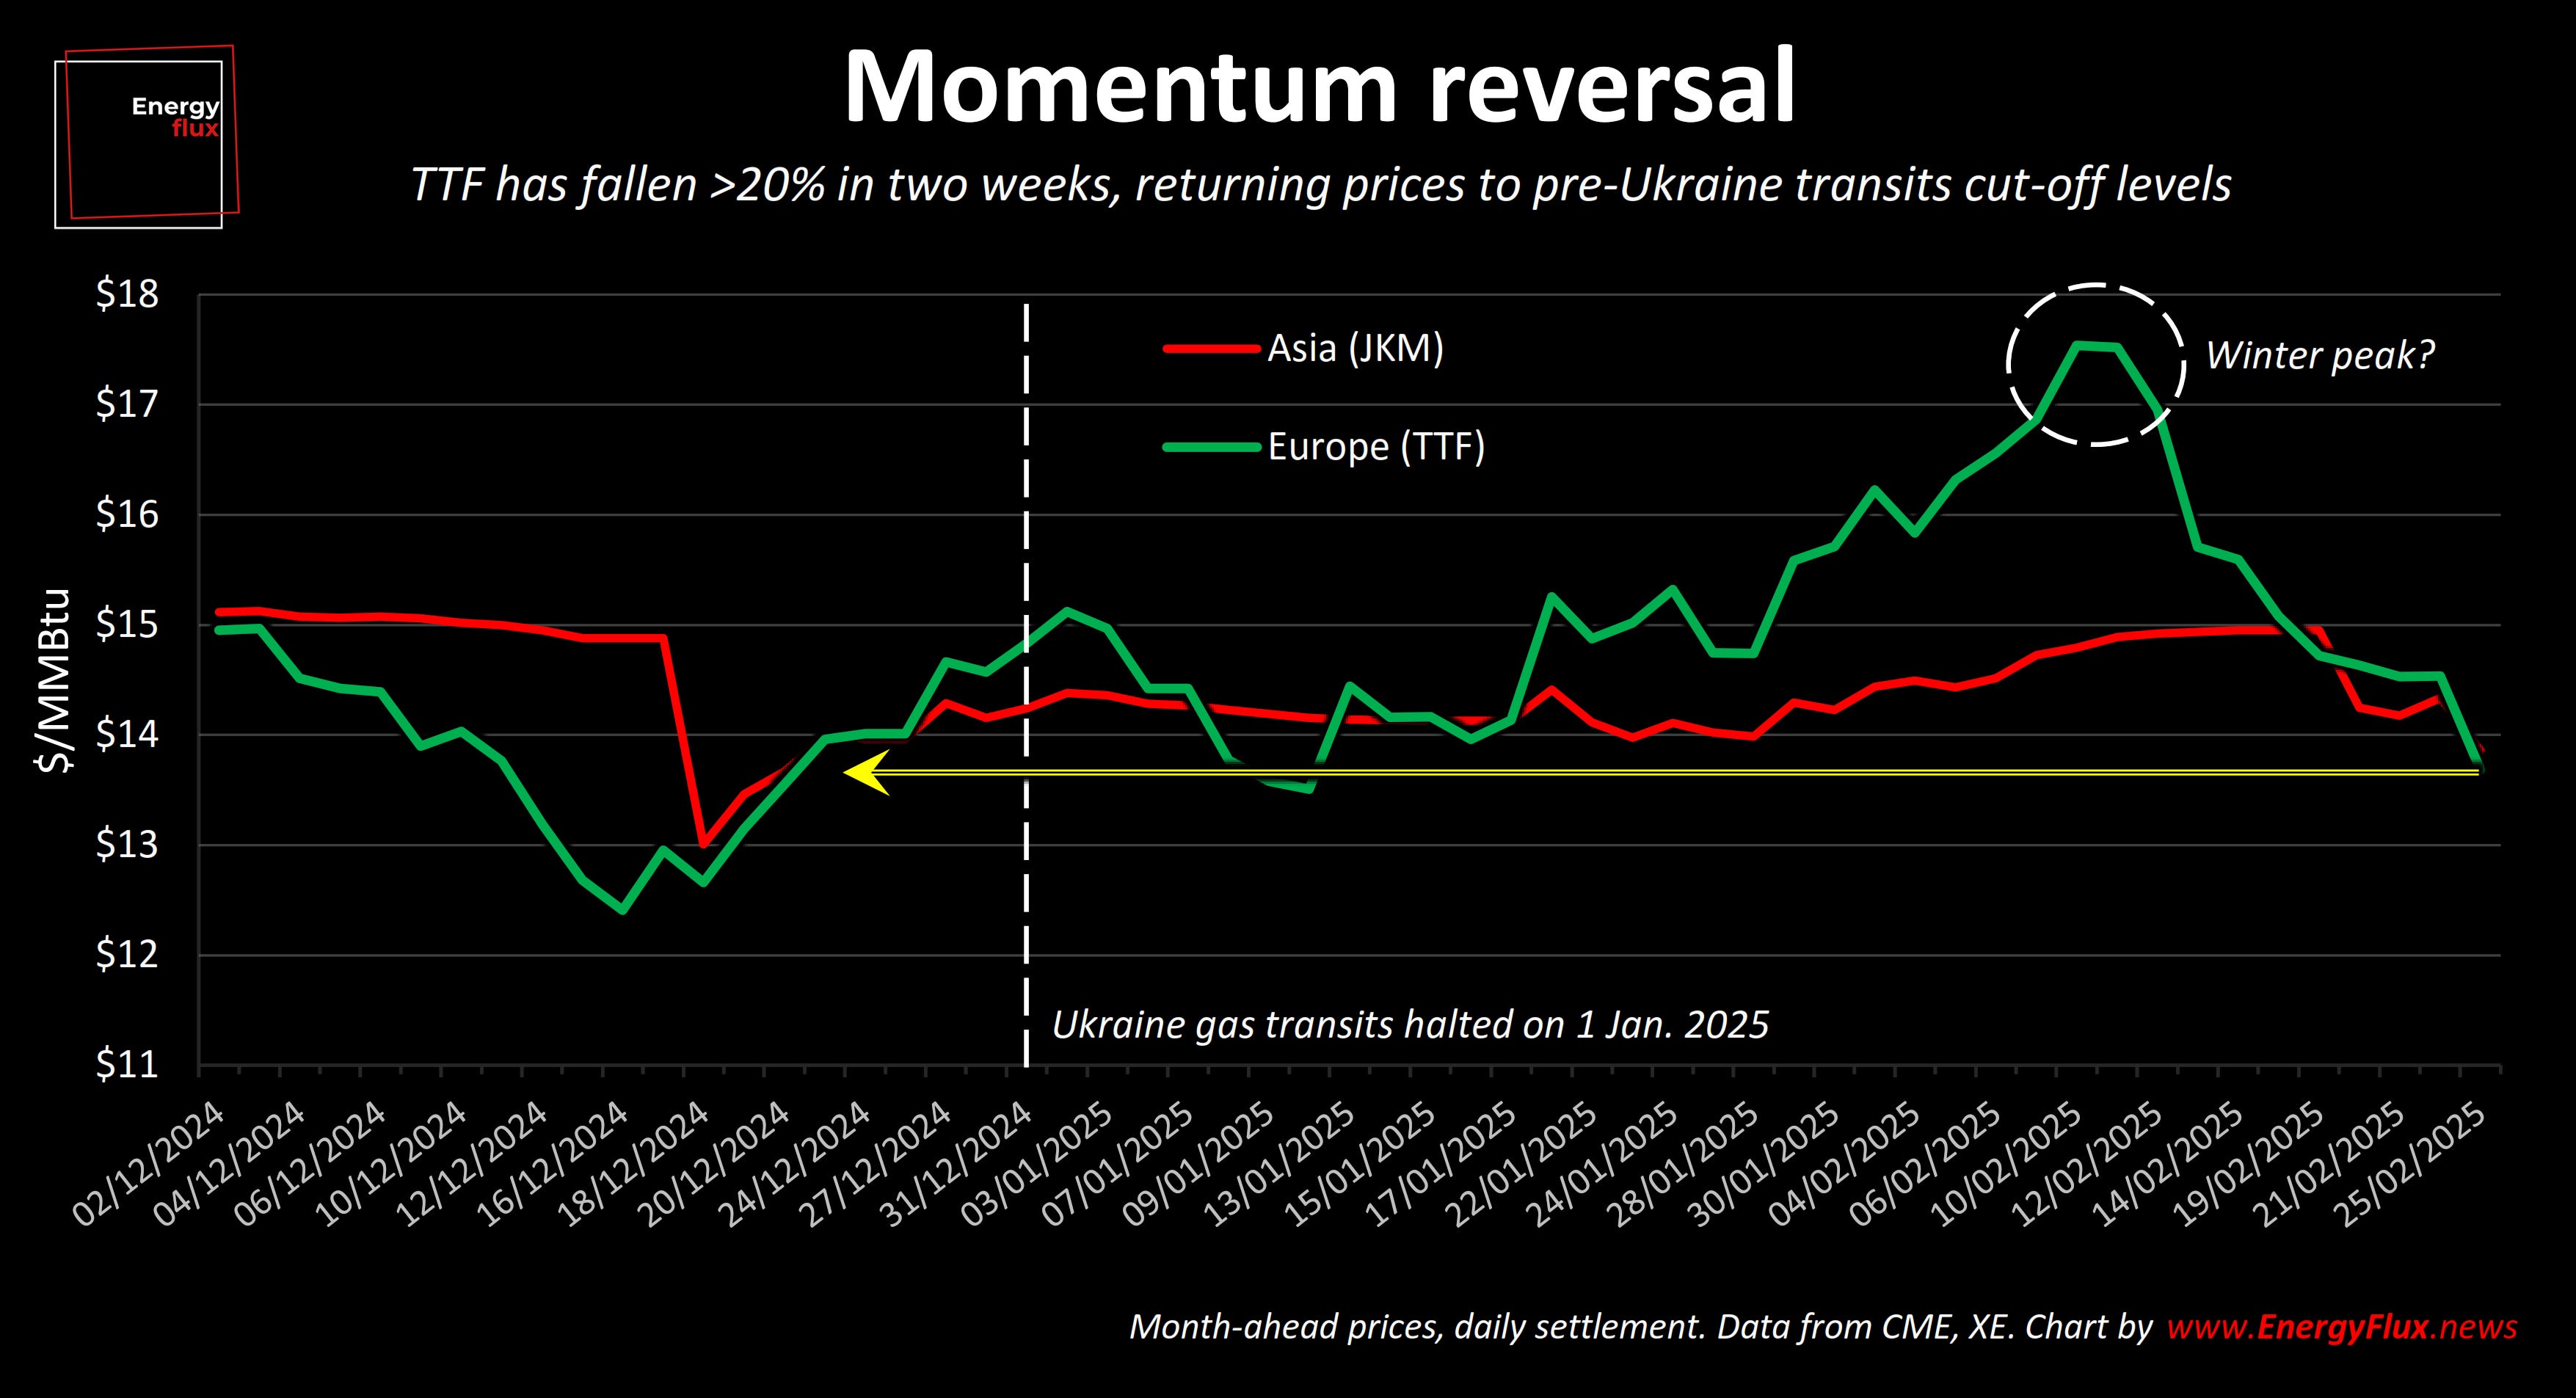
The dramatic reversal is still gaining pace: Dutch TTF, the European benchmark gas hub, has fallen by one fifth since it peaked at €58 per MWh on 10 February.
The front-month contract (Mar-25) lost 12% this week alone, dipping to €41/MWh ($13/MMBtu) on Tuesday. These are prices not seen since mid-December, before the loss of Ukraine gas transits.
The most significant aspect of this reversal is the narrowing of the summer-winter spread.
The summer 25 contract is now trading at less than €1 above winter 25-26, having peaked above €6 just a few short weeks ago. For next year, the summer 2026 contract is back below the following winter (i.e. a return to seasonal ‘normal’).
Independent analyst John Kemp captured the summer-winter spread collapse in this exquisite chart:
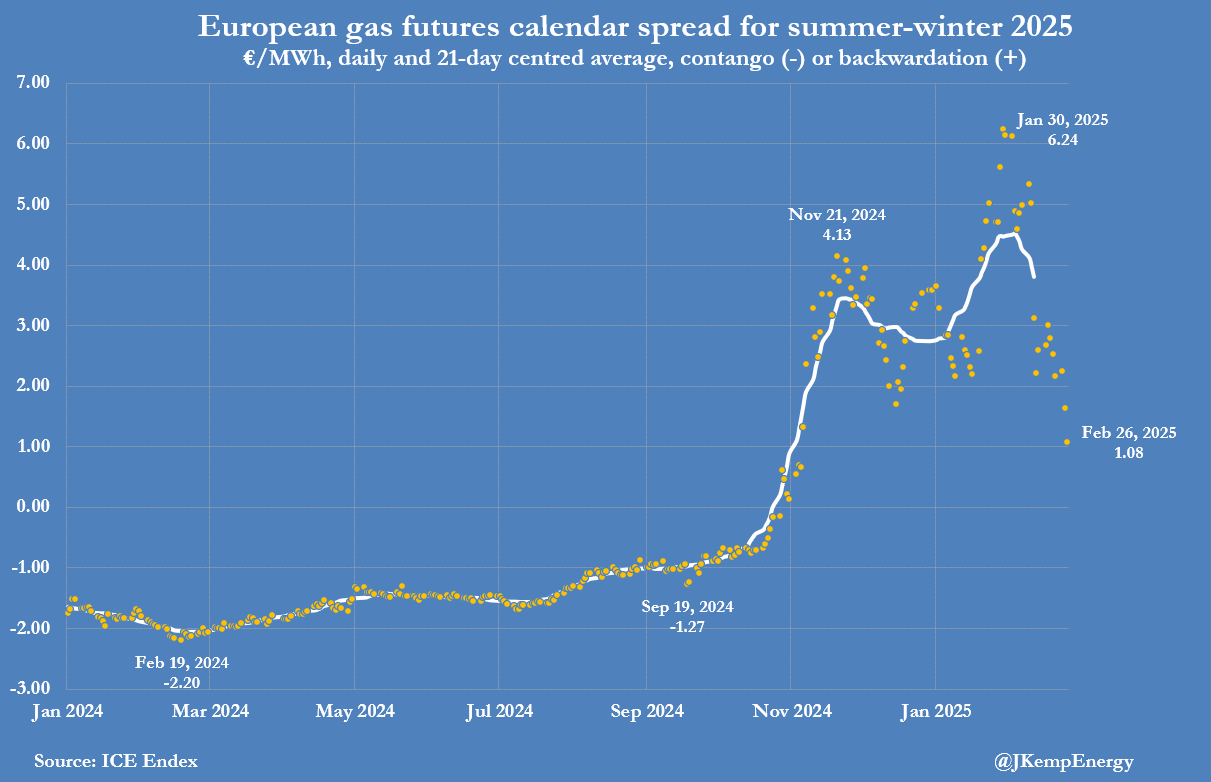
Regular readers will be well aware that the negative spread was fuelled by speculative capital sloshing into long summer positions in a bid to corner the refilling market.
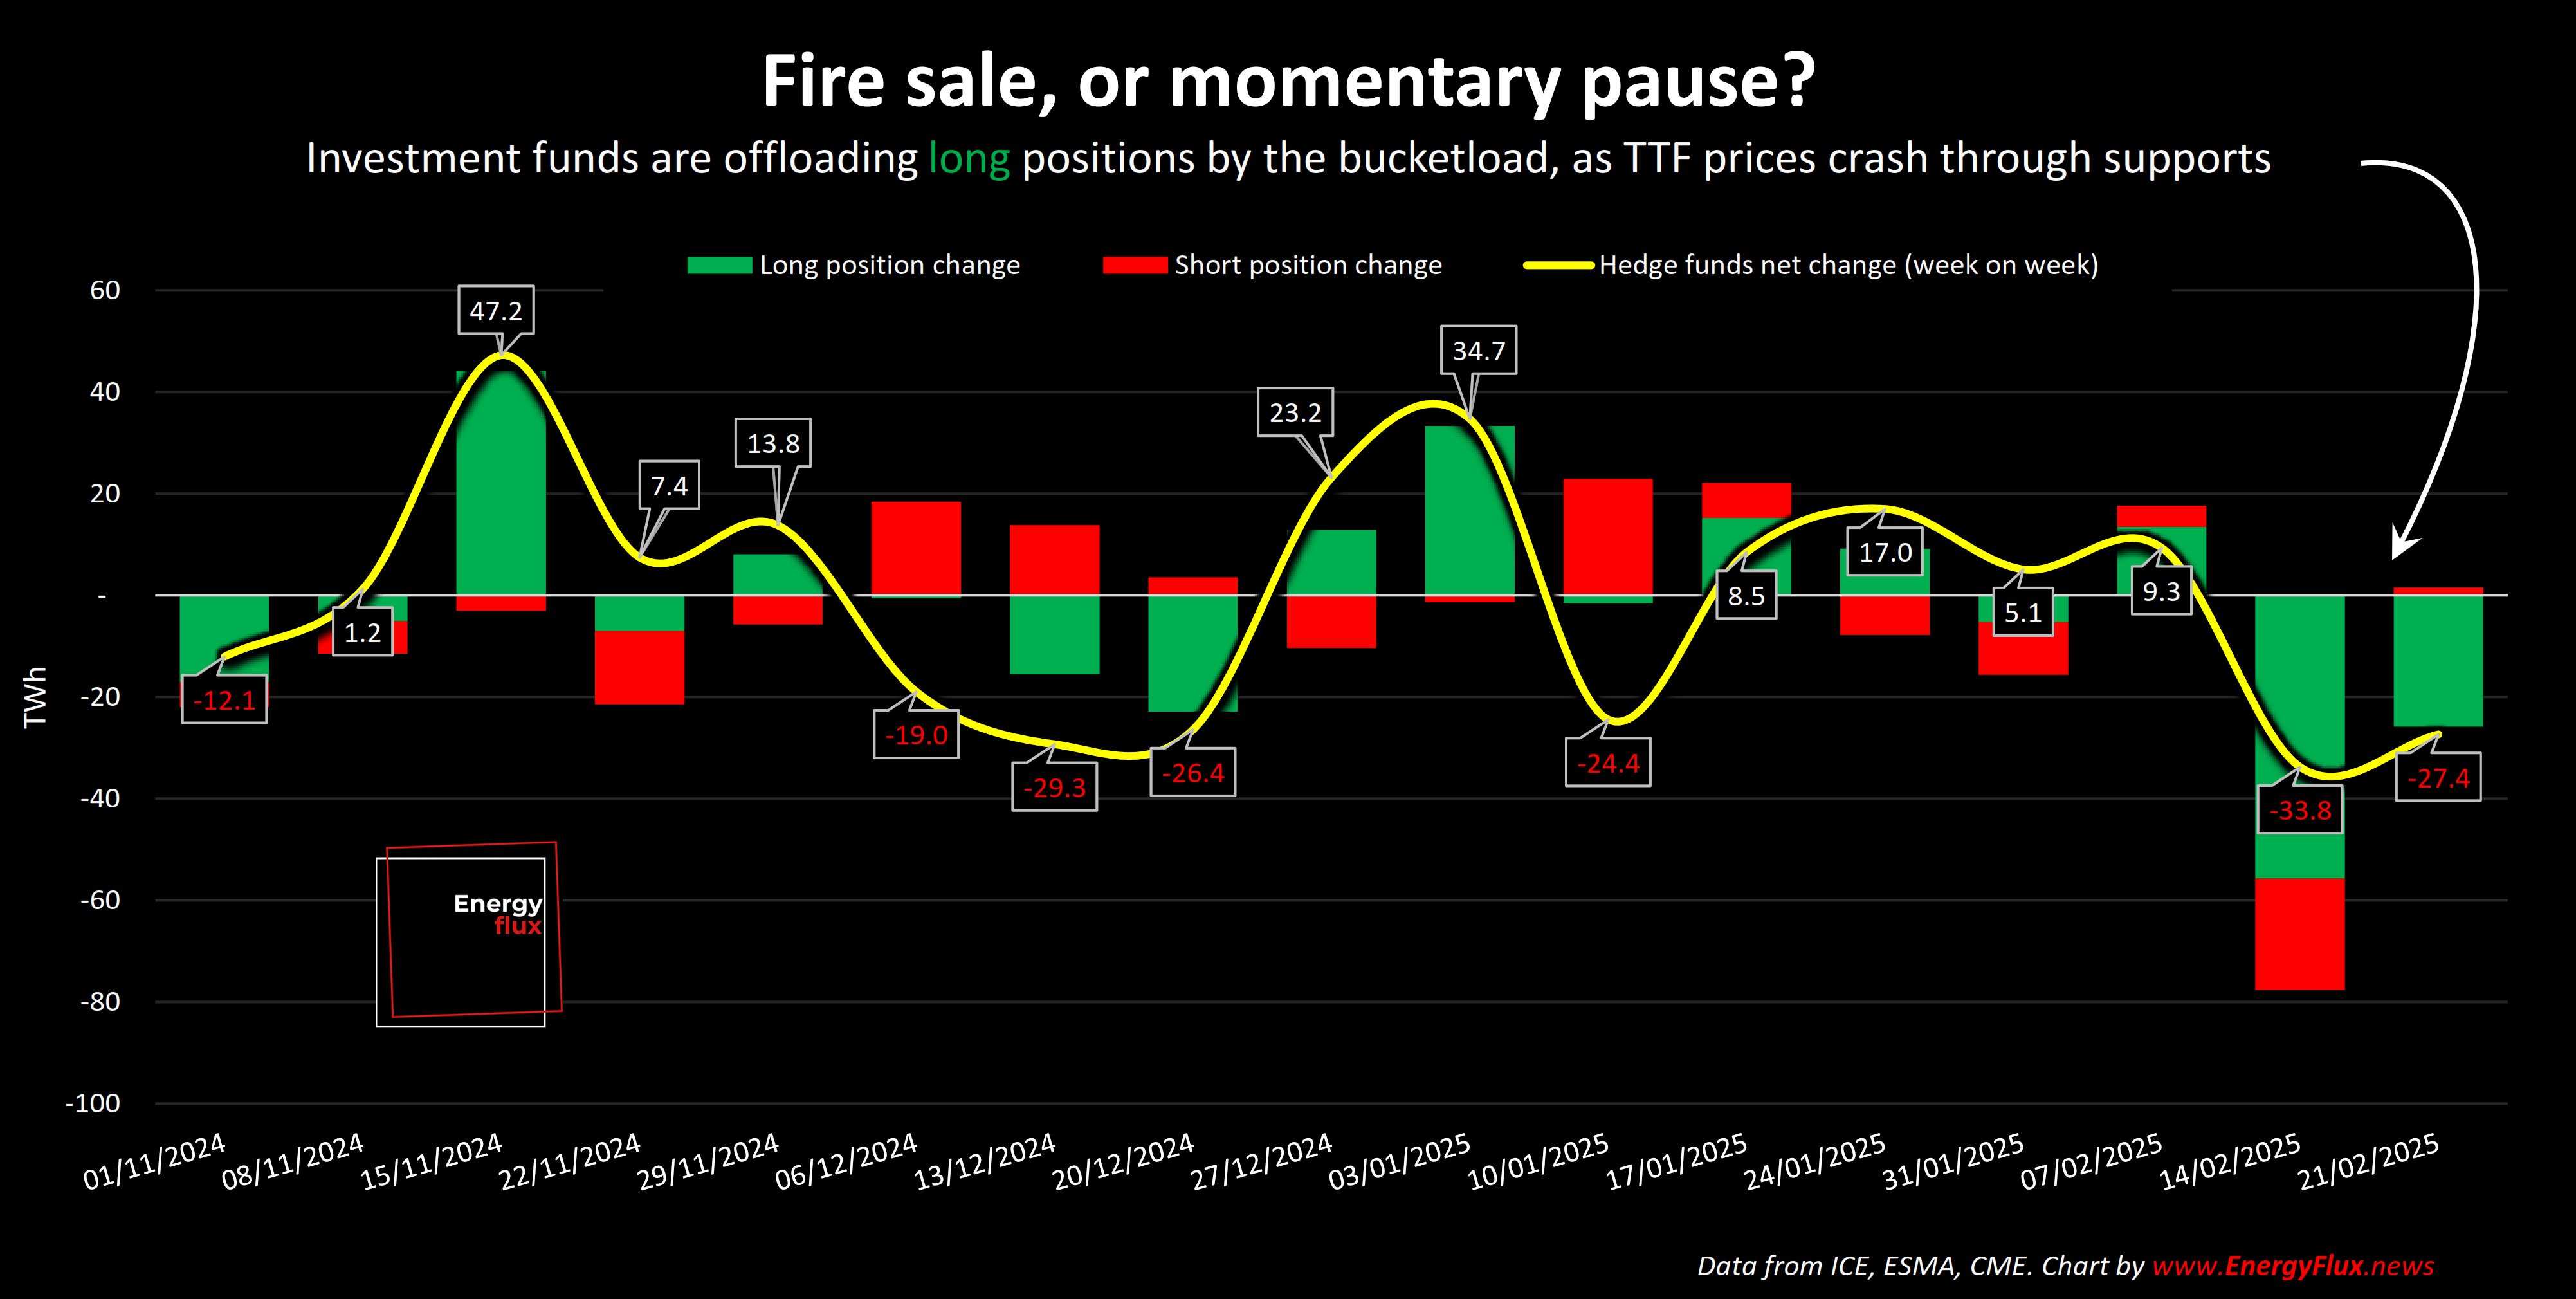
Yes, the current correction is (predictably) nothing to do with supply-demand fundamentals and everything to do with investment funds: the speculative ‘tourists’ with deep pockets taking directional bets on TTF gas futures big enough to move the market.
The only thing sustaining the 2024 bull run into 2025 was the expectation of heightened competition for liquefied natural gas (LNG) over the summer to achieve the EU’s 90% refilling target by 1 November.
That reality has not diminished; EU-wide gas storage levels are below 40%. While not abnormally low by historic standards, refilling to 90% still poses a challenge in the absence of Russian pipeline gas inflows.
High-level machinations around a possible relaxation of the gas storage regulation captured the imagination of newspaper editors, with a slew of misleading headlines suggesting the European Commission has acquiesced to member state demands to lower the 2025 target.
Investment funds are in panic mode because they trade on headlines and fear regulators are about to pull the rug from under their epic TTF long position.
However, the situation is more nuanced than fund movements suggest. A closer inspection of regulatory overtures from Brussels tells us that the EU gas market is (as usual) trading on incomplete information.
This special EU LNG Chart Deck sets the record straight. It reveals what’s really driving the TTF selloff, why the investment funds are at risk of over-reacting, and what we know (and don’t know) about the EU’s ongoing review of gas storage regulations.
It also explores how the TTF selloff is impacting:
Global LNG trade flows and cargo diversions
The TTF-JKM spread and US-Asia arbitrage across the futures curve
Shifting EU LNG netbacks from global FOB locations
The competitiveness of Asian spot LNG versus oil-indexed contracts
If you’re looking for a balanced and comprehensive assessment of how Europe’s febrile gas market is reshaping global LNG trade dynamics, this post is for you. Sign up now for full access, and support independent energy market analysis.
💥 Article stats: 2,300 words, 11-min reading time, 18 charts and maps