Jedi mind trick
This is not the bearish gas market you are looking for | EU LNG Chart Deck: 20 November 2024
“You weak-minded fool!” — Jabba the Hutt, Return of the Jedi
In a galaxy far, far away (also known as Europe’s gas market) there is no such thing as objective reality. Like a Jedi mind trick, intangible ‘scarcity’ has captivated trading sentiment. As ever, risk perception trumps physical realities when it comes to gas price formation.
The recent shenanigans around Russian gas supplies into Austria provide further proof, as if any where needed, of the unwavering supremacy of perception in the hierarchy of influence.
Late last week, Gazprom stopped supplying gas directly to OMV. This is because OMV stopped paying Gazprom under its long-term contract in an attempt to recover a €230 million arbitration award.
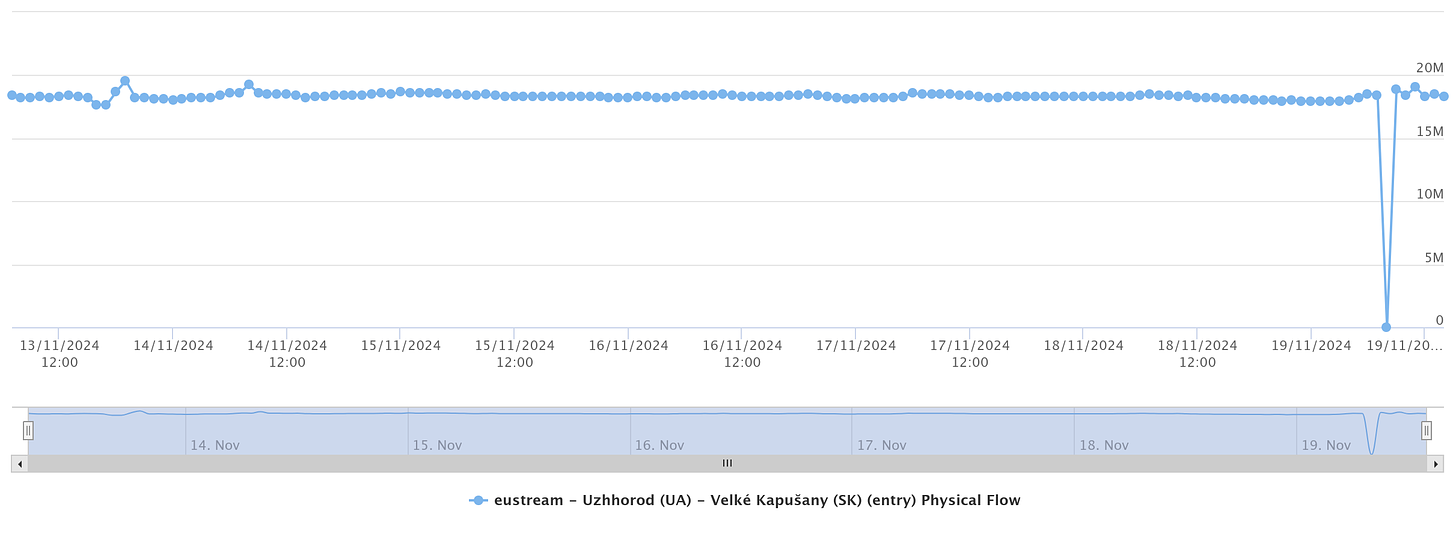
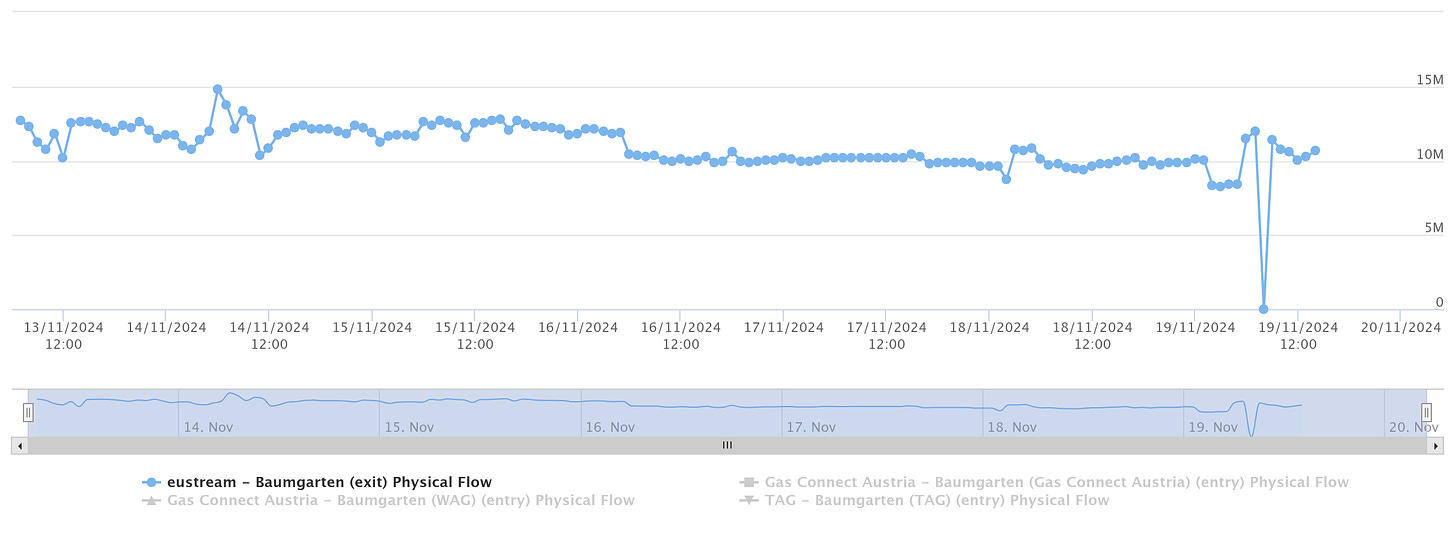
OMV said Gazprom would halt gas supplies on Saturday. But data from the ENTSOG Transparency Platform show Russian gas kept flowing into Austria via Ukraine and Slovakia.
All that changed was the buyer of the molecules. Gazprom is believed to be selling gas originally intended for OMV to traders and other secondary buyers in Austria and Slovakia.
Buy the risk…
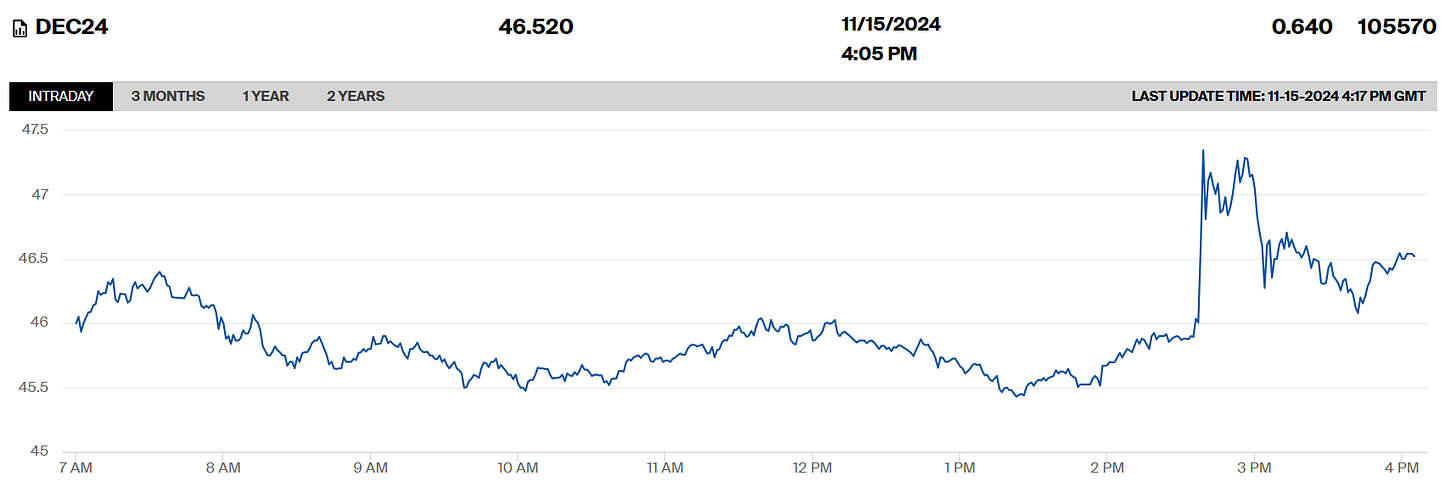
Traders were quick to price in the anticipated disruption to Russian gas inflows before they materialised.
Prices on Dutch TTF, the European benchmark, spiked above €47/MWh to a year-to-date high during intra-day trading last Friday, when OMV’s announcement hit the newswires.
…sell the reality
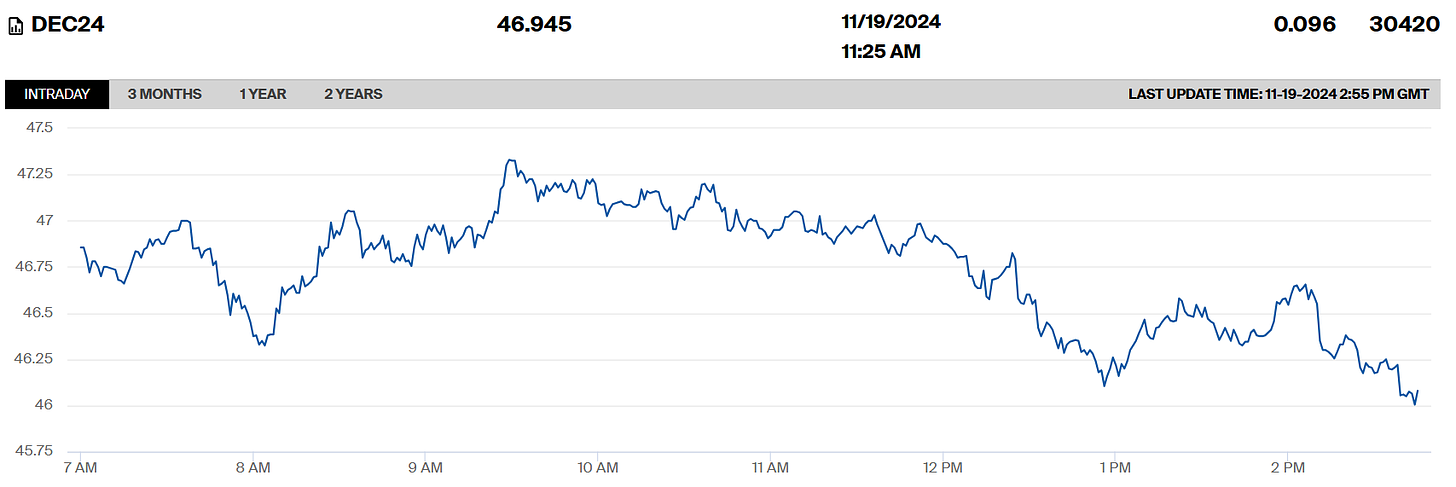
Those gains were gradually pared back in subsequent trading sessions as the reality dawned that no disruption was forthcoming.
The TTF front month contract (Dec-24) closed Tuesday’s session at €46/MWh — pretty much where it was prior to OMV’s news.
These theatrics are a taster of what’s to come. After months of (figurative and literal) speculation, the moment of truth around Russian gas transits is fast approaching.
Does Europe even need this gas? Will the bullish spell wear off before the market finds out?
💥 Article stats: 1,550 words // 8-min reading time // 14 charts, graphs & maps


