


Burning the house down
Investment funds torch €8bn of EU gas futures in record TTF selloff | EU LNG Chart Deck: 6 March 2025

Hedge funds are fleeing the European gas market faster than at any time since records began.
Investment funds offloaded a whopping 57 TWh of net long positions last week on Dutch TTF, the benchmark gas trading hub for most of Europe.
That volume of paper gas bets is equivalent to the entire annual consumption of Greece, gone up in smoke.

This episode marks the third successive week of selloffs. Since 10 February, funds have offloaded 118 TWh of net length and triggered a 25% price correction.
In other words, hedge funds have torched €8 billion of bullish gas positions in three chaotic weeks.
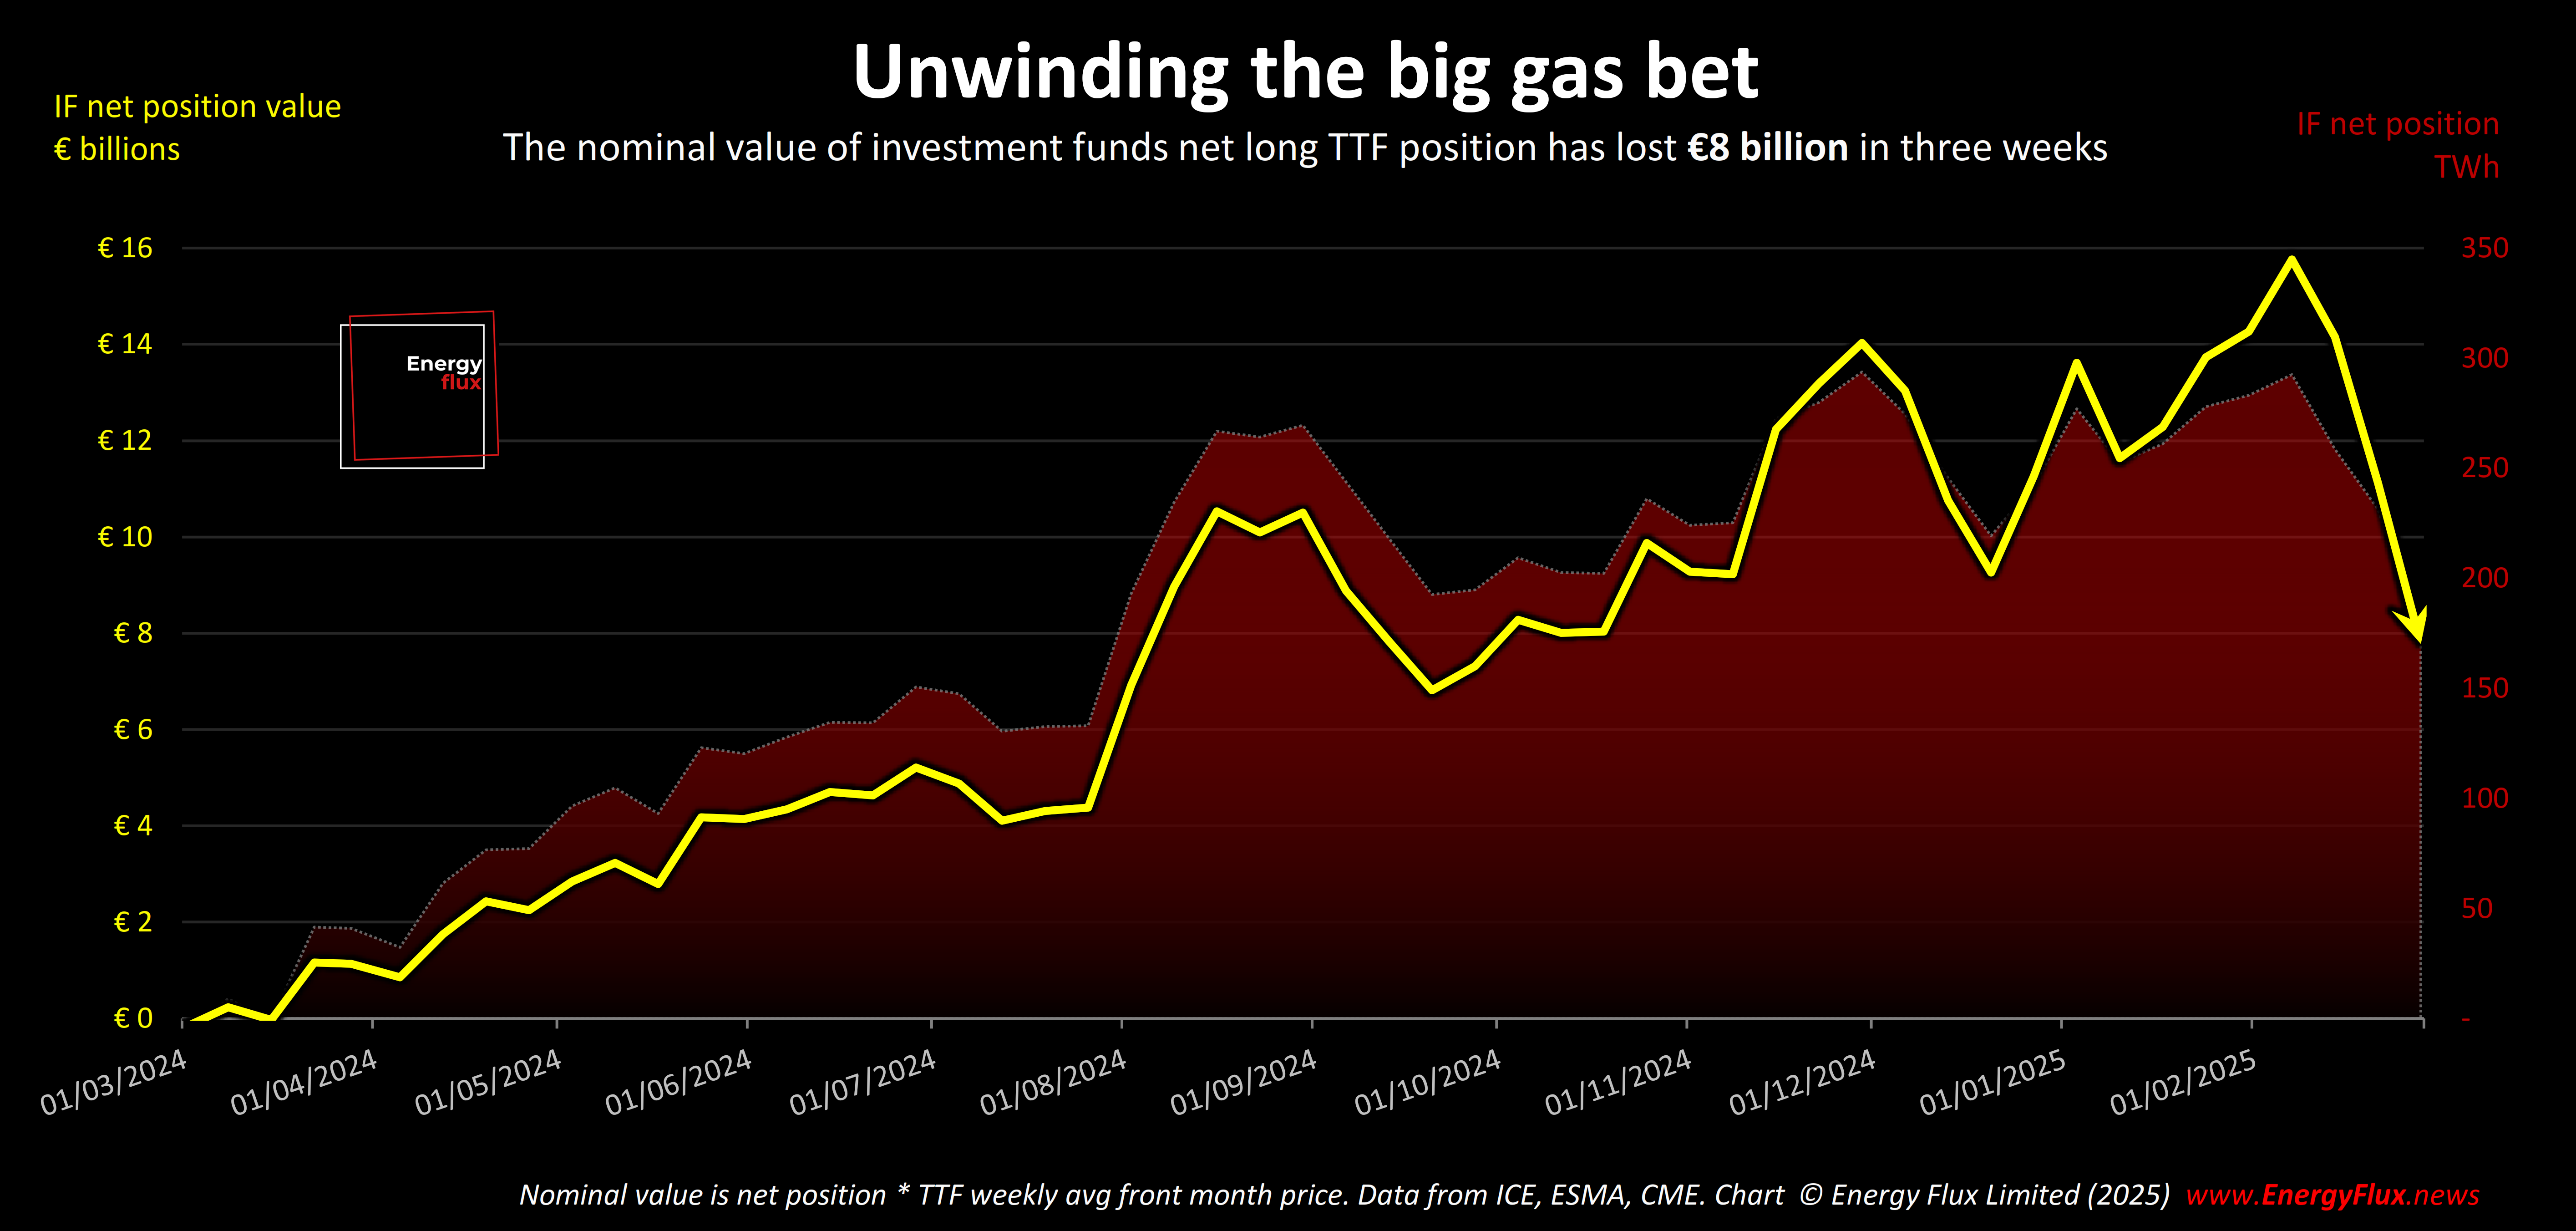
The European gas market has literally never seen anything like this.
Technically, there was a deeper selloff in April 2021. But that mass liquidation event was immediately followed by a surge in rebuying. That event was a blip. This appears to be something much deeper.
Investment funds are probably the single biggest driver of TTF price action. Last week’s unprecedented exodus strongly suggests the bull run that began in early 2024 has finally run its course.
However, there is a growing risk of over-correction stemming from extreme fund movements.
This week’s EU LNG Chart Deck crunches the numbers from the latest ICE Endex Commitment of Traders report to gauge market momentum and tease out underlying trends. It includes:
💥 Granular analysis: Long, short and net position changes for Investment Funds & Commercial Undertakings ➡️ Who is selling what, and why?
💥 The TTF Sentiment Tracker: Regression analysis of weekly fund movements vs price action ➡️ What does a strengthening correlation tell us?
💥 Historical context: Changes in net positions have shaped pricing regimes since 2020 ➡️ Are we in a new market phase?
💥 Underlying drivers: Geopolitics and EU regulations are pulling in opposite directions ➡️ Which one has the upper hand?
This datavis-packed update gives you chapter and verse on the European gas market at this critical juncture. Subscribe now for full access.
Article stats: 2,000 words, 9-min reading time, 15 charts and graphs