


Appearances can be deceiving
Is the TTF selloff bottoming out? | EU LNG Chart Deck: 13 March 2025

At first glance, the Dutch TTF natural gas market looks like it’s in freefall.
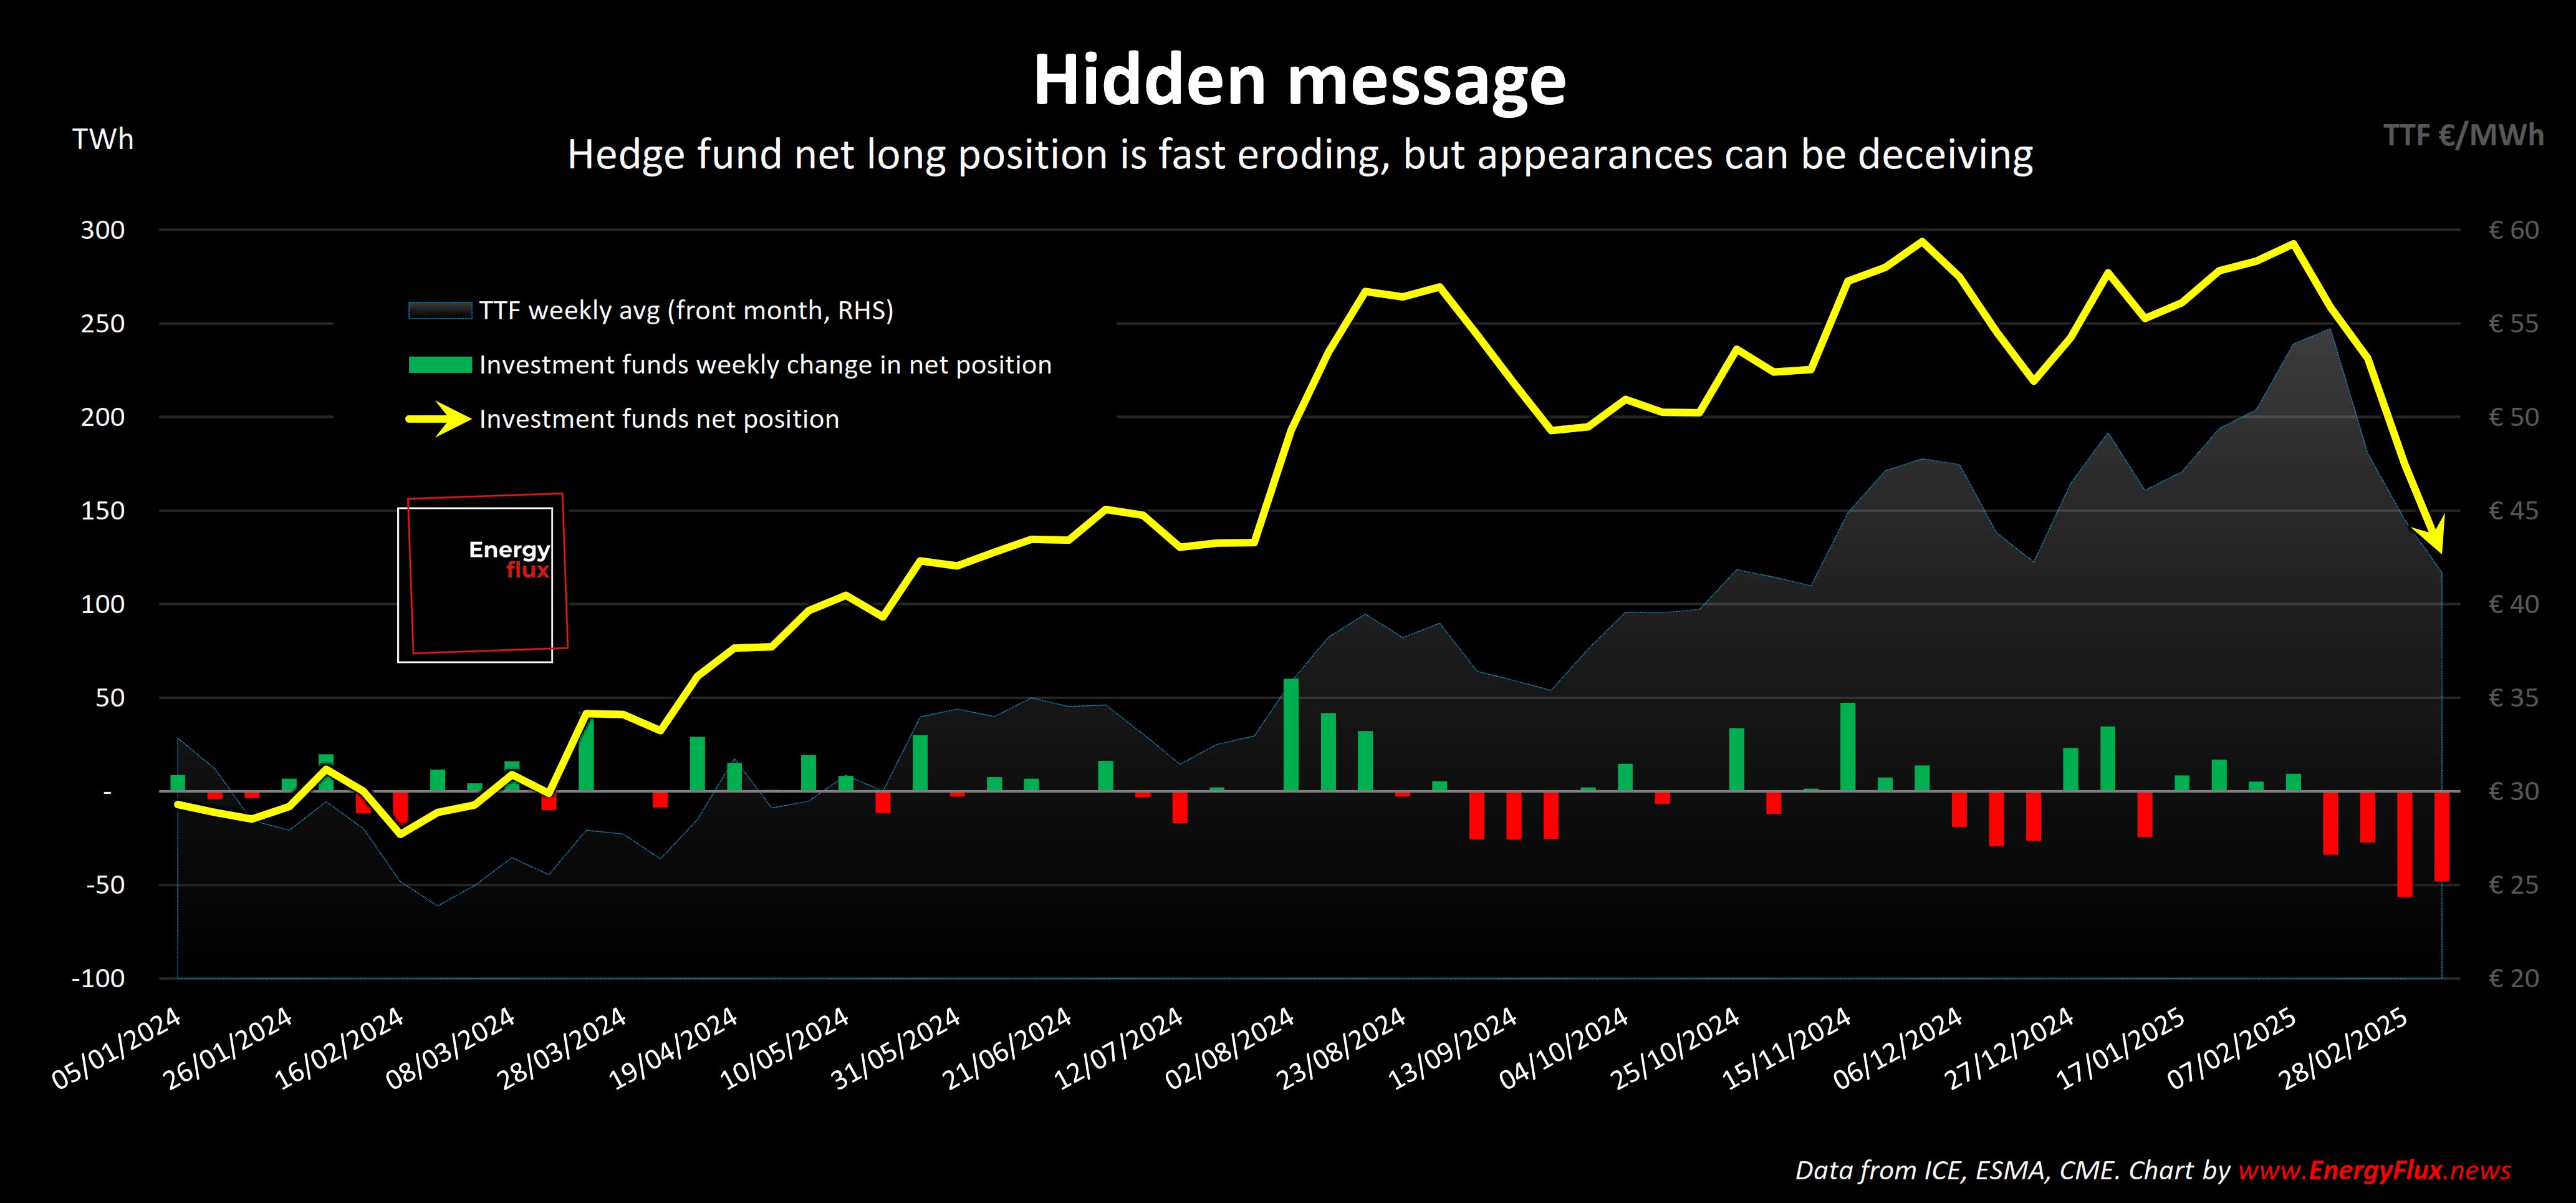
Over the past month, hedge funds have slashed their bullish bets at an unprecedented pace, dumping long positions and driving prices sharply lower.
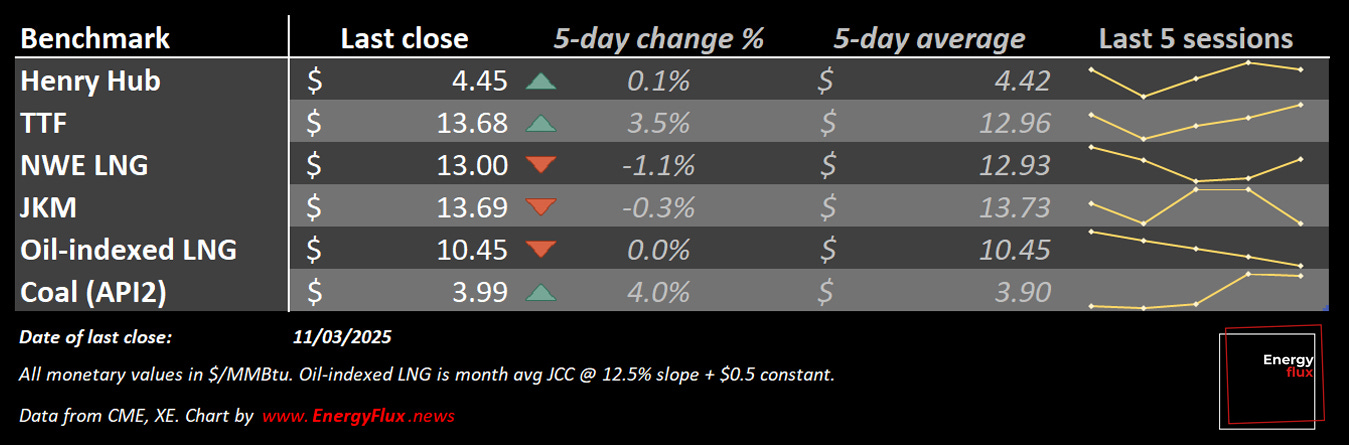
Funds reduced their net length by another 48 TWh last week, according to the latest ICE Endex Commitment of Traders report.
This appeared to mark a fourth successive week of speculative length being purged from the market.
Fund net length now stands at 127 TWh, having fallen by a whopping 166 TWh since early February.
The nominal value of funds’ bullish bets has dropped by two-thirds — a staggering €10 billion — over this timeframe.
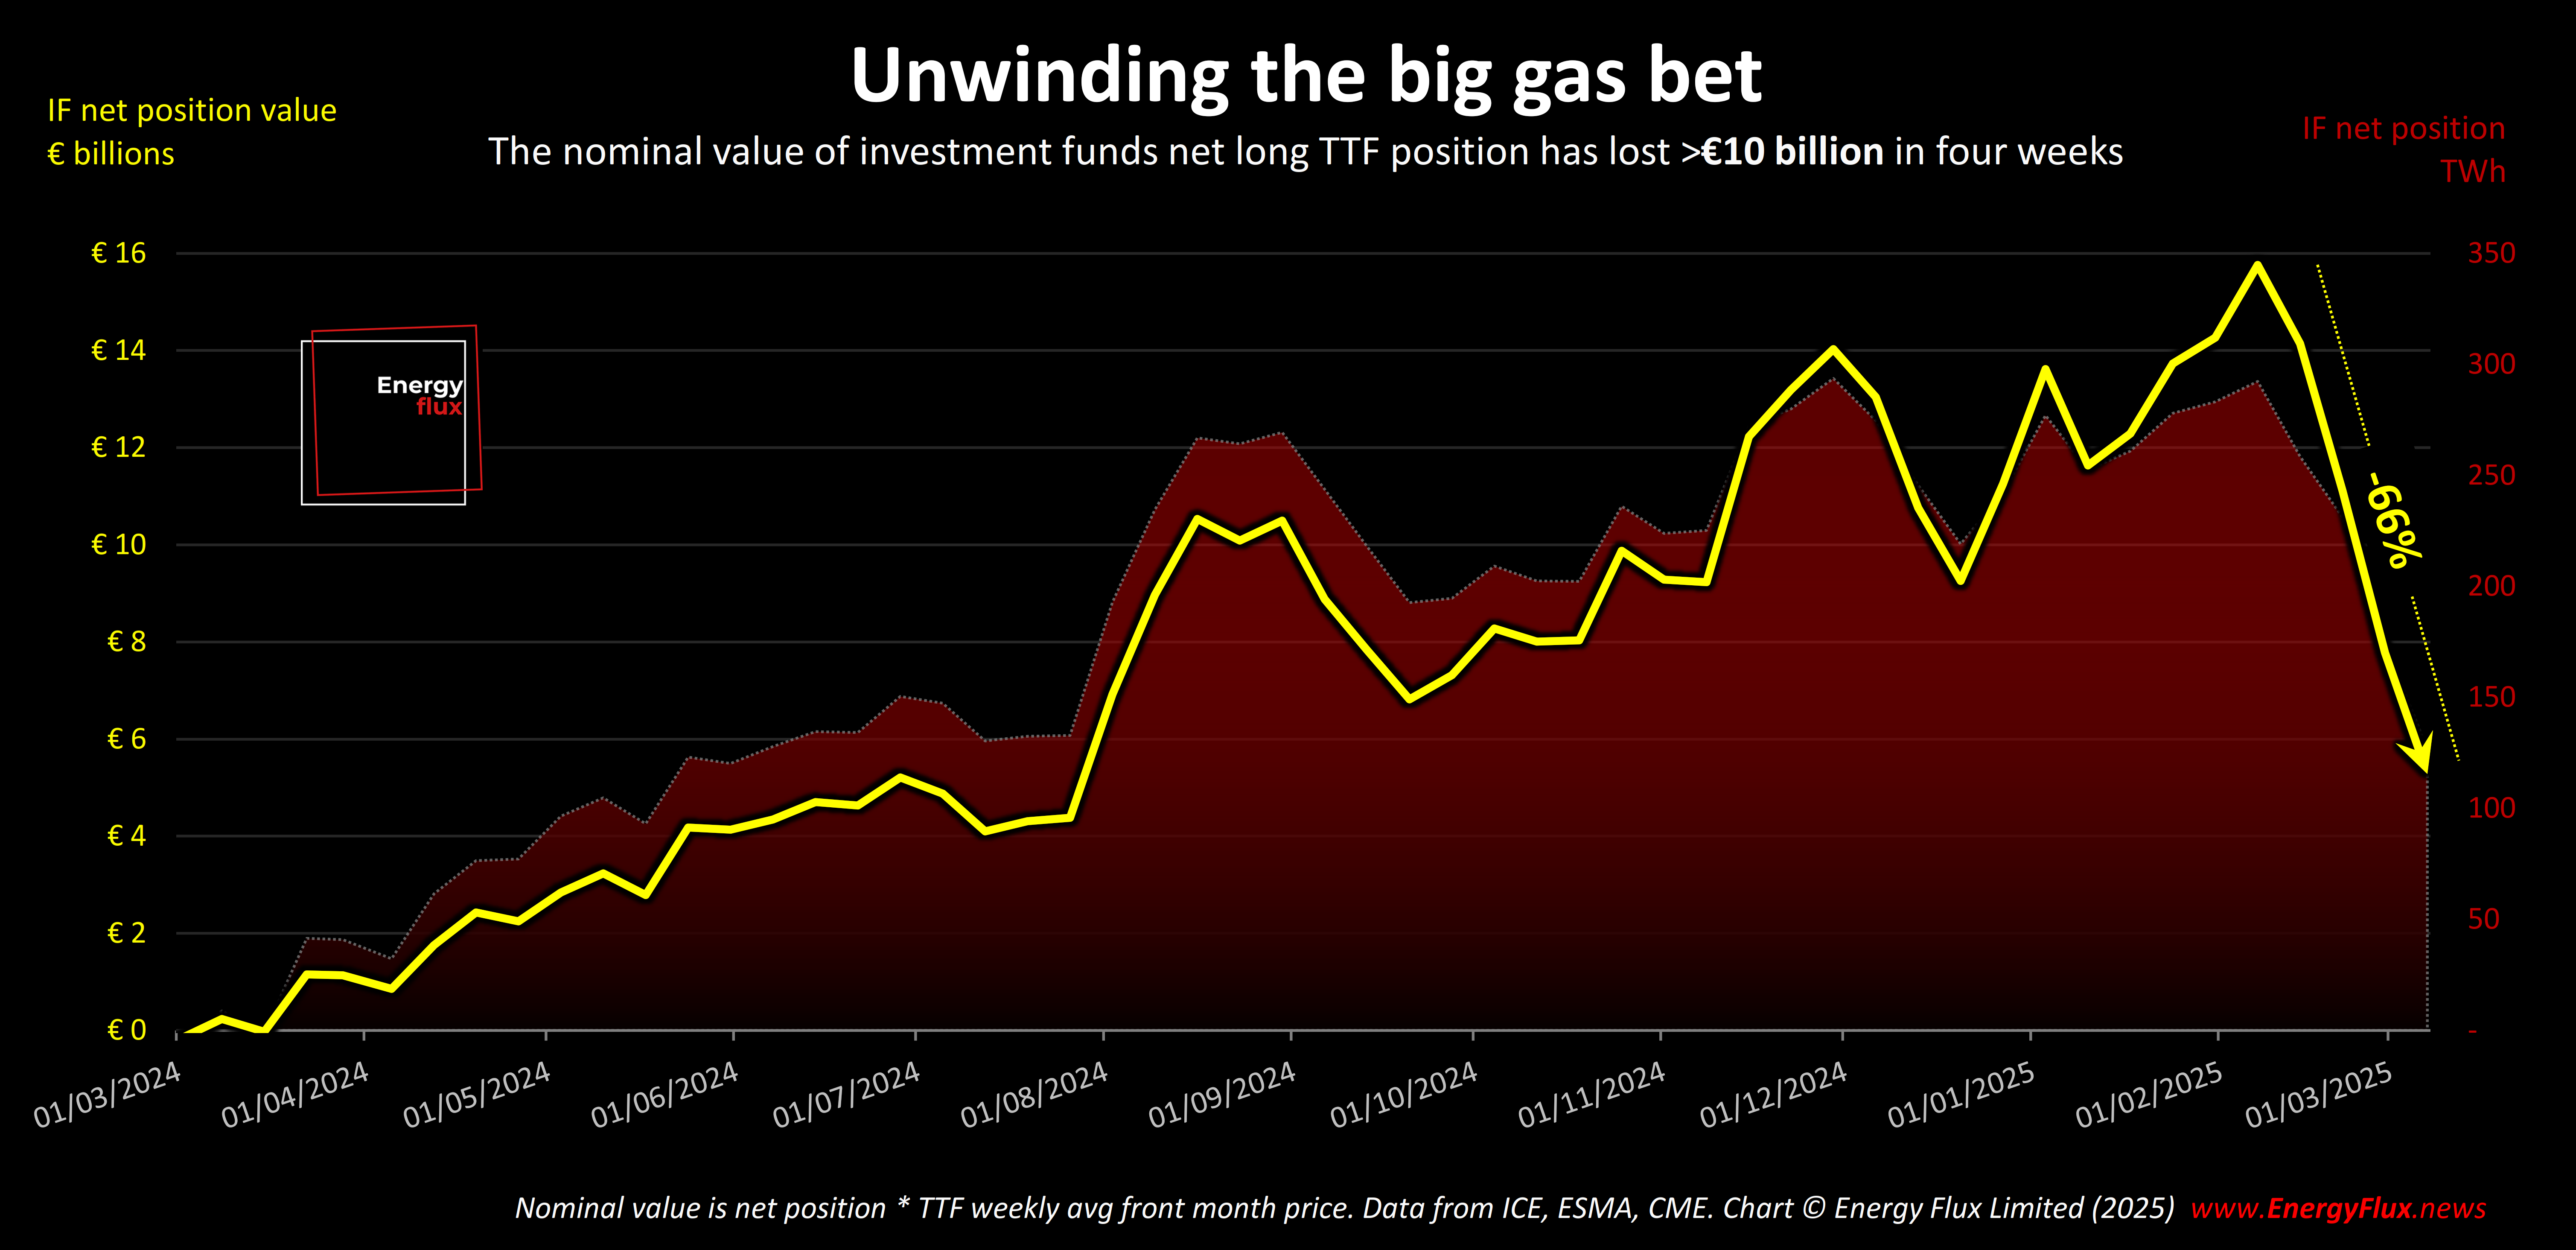
The bloodletting has been swift and brutal, reinforcing the perception that sentiment has turned decisively bearish.
But beneath the surface, something doesn’t quite add up. Investment funds quietly shifted tactics last week, signalling doubts about the doom-laden price action.

This week’s EU LNG Chart Deck analyses the behaviour of hedge funds and physical gas players to figure out whether TTF has over-corrected — and where the market might be heading next.
Subscribe now for full access, and support independent market analysis.
👉 Prefer corporate invoicing? I offer that too. Get in touch for more details 👈
💥 Article stats: 1,200 words, 6-min reading time, 15 charts, graphs and maps